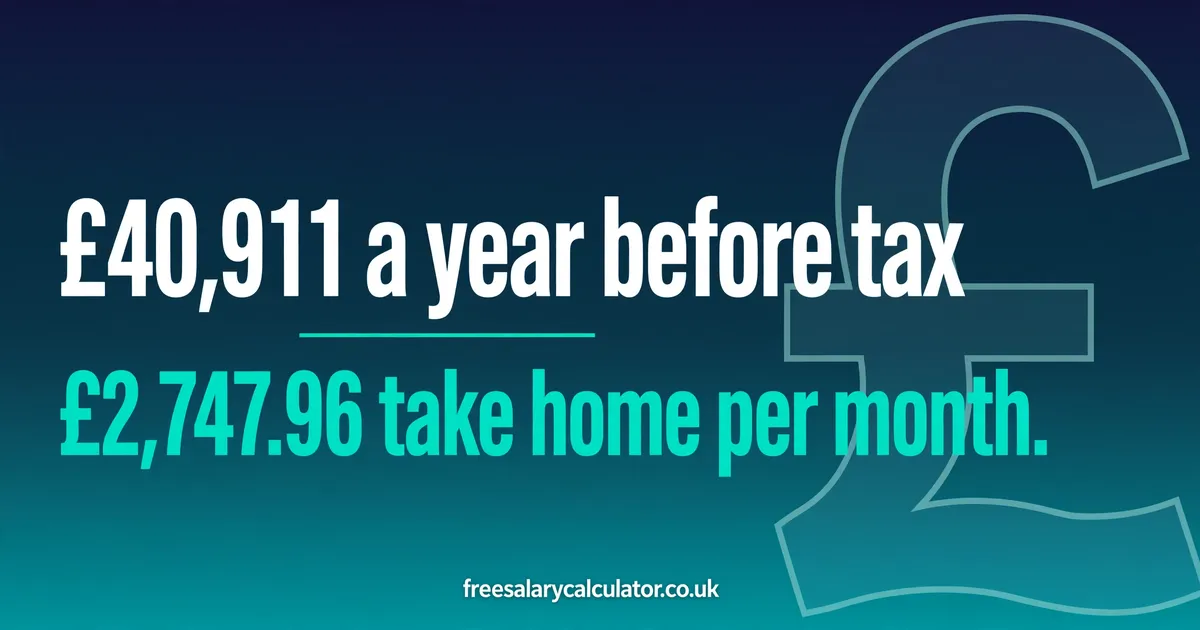
The average salary by job uk data shows a wide pay gap between jobs. The typical full time worker earns £40,911 a year before tax, which leaves £2,747.96 a month after tax in 2026/27. Managers earn far more than carers, so the job you do matters more than the national average.
One national average hides the real story. A chief executive earns more than four times the typical worker, while a care worker earns little more than half of it. Hours, location, overtime and sector all shift the final figure.
This guide compares the average salary by job uk across the nine broad job groups the Office for National Statistics tracks, then looks at the best paid and lowest paid jobs in detail. Every take home figure uses the 2026/27 tax and National Insurance rates.
What is the average salary in the UK right now?
The Office for National Statistics puts median gross annual earnings for full time employees at £40,911 in April 2026. That figure is provisional, and it is 4.5% higher than the £39,157 recorded in April 2025. The median is the middle earner.
The same survey gives median weekly earnings of £811.20 for full time employees, up 5.8% on the year, and median hourly earnings of £20.81 before overtime. Weekly pay rose faster because the two measures cover slightly different groups. The annual figure only counts people who stayed in the same job for at least a year.
Do not mix the median with the mean. The mean is the simple average, and it is pulled up by very high earners.
In April 2025 the mean full time salary was £48,512, well above the median for the same year. The median is the better guide to typical pay.
What is the average salary by job uk for each type of work?
The Office for National Statistics groups every job into nine broad groups. The table below shows the average salary by job uk for each group, using median gross pay from April 2025, with take home pay at 2026/27 rates.
| Job group | Median gross a year | Income tax | National Insurance | Take home a year | Take home a month |
|---|---|---|---|---|---|
| Managers, directors and senior officials | £56,653 | £10,093 | £3,144 | £43,416 | £3,618.01 |
| Professional occupations | £48,739 | £7,234 | £2,894 | £38,612 | £3,217.64 |
| Associate professional occupations | £37,960 | £5,078 | £2,031 | £30,851 | £2,570.90 |
| Skilled trades occupations | £36,093 | £4,705 | £1,882 | £29,507 | £2,458.88 |
| Process, plant and machine operatives | £33,835 | £4,253 | £1,701 | £27,881 | £2,323.40 |
| Administrative and secretarial occupations | £30,461 | £3,578 | £1,431 | £25,452 | £2,120.96 |
| Elementary occupations | £27,620 | £3,010 | £1,204 | £23,406 | £1,950.50 |
| Caring, leisure and other service occupations | £27,198 | £2,926 | £1,170 | £23,102 | £1,925.18 |
| Sales and customer service occupations | £26,959 | £2,878 | £1,151 | £22,930 | £1,910.84 |
The gap between the top and bottom groups is wide. A manager takes home £3,618.01 a month, while a sales worker takes home £1,910.84 a month.
That is a difference of £1,707.17 a month. The professional group, which covers teachers, nurses and engineers, sits in the top half at £3,217.64 a month.
Pay has risen since these group figures were collected. The April 2026 survey shows managers up 6.7% on the year, caring roles up 5.4% and machine operatives up 4.1%, so the next release will show higher figures.
Each group still covers a wide range of jobs. The next section looks at single jobs, where the picture is sharper.
What do the highest and lowest paid jobs earn?
At the top of the average salary by job uk scale, chief executives and senior officials earn a median of £99,944 a year, according to the Annual Survey of Hours and Earnings for April 2025. After tax and National Insurance that leaves £5,710.41 a month, or £68,525 a year.
Specialist doctors follow at £92,847, worth £5,367.39 a month after tax. IT directors earn £86,033, worth £5,038.05 a month, and financial managers and directors earn £81,420, worth £4,815.08 a month.
Train drivers show how a skilled operational job can pay well above the national median. The median train driver earned £74,376 in April 2026, which leaves £4,474.62 a month after tax. Our train driver salary after tax guide covers trainee pay, overtime and the railway pension.
At the other end, teaching assistants earn a median of £21,239 a year, worth £1,567.64 a month after tax. Care workers earn £22,105, worth £1,619.60 a month.
The gap between the best paid and lowest paid jobs is stark: a chief executive takes home £4,142.77 a month more than a teaching assistant. Our care worker salary after tax guide shows what carers keep at three common pay levels.
What does the typical worker take home each month?
Take the typical full time worker on £40,911 a year, the April 2026 median. You pay £5,668 of income tax and £2,267 of National Insurance in 2026/27, leaving £32,976 for the year. That is £2,747.96 a month, or £634.14 a week, in your pocket.
The first £12,570 is tax free thanks to the personal allowance. You pay 20% on the rest up to £50,270, which is why the tax bill is £5,668.
National Insurance is 8% on pay above £12,570 up to £50,270, which gives £2,267. See our full £40,000 after tax breakdown, confirmed live at £2,693.30 a month.
In Scotland the same salary leaves £2,741.78 a month, £6.18 a month less than in England, Wales and Northern Ireland, because Scottish bands charge more on middle pay. A 5% pension through salary sacrifice would cut take home pay to £2,625.23 a month, while a Plan 2 student loan would take another £86.45 a month. You can work out your exact take home pay with our free UK salary calculator.
Why does the same job pay differently in different places?
The average salary by job uk figures are national medians, so they hide big local gaps. London saw the fastest pay growth in the April 2026 survey, up 8.2% on the year, driven by a rise in professional jobs in the capital.
The East Midlands and the North West grew slowest, at 4.0% and 4.1%. A teacher or nurse in London also gets extra London weighting on top of the national pay scale.
Sector matters too. In April 2026 the median weekly pay in the public sector was £862.20, against £794.40 in the private sector. Health and social work saw pay grow 7.3% on the year, the third fastest of any industry.
That growth came mainly from more higher paid health professionals joining the workforce. Experience, hours and overtime shift pay as well, so if you want to compare two jobs properly, compare the take home pay, not the headline salary. Our salary comparison tool puts two salaries side by side after tax.
How to check your payslip in five steps
Check your payslip every month. These five steps catch mistakes early:
- Check your gross pay first. Multiply your hourly rate by the hours you worked, including overtime, and compare it with the gross pay on the slip.
- Check your tax code. The standard code is 1257L. If your code is different, ask your employer or check with HMRC, because the wrong code can mean you overpay tax during the year.
- Check your National Insurance. On the median salary of £40,911 it should be about £188.92 a month. A figure far above that may mean your employer has used the wrong threshold.
- Check your pension deduction. If you pay 5% through salary sacrifice on £40,911, the deduction should be £170.46 a month, and your take home pay should be £2,625.23.
- Check your hours and overtime. Make sure every shift you worked is listed, including night and weekend hours, and raise missing hours with your manager the same week.
Frequently asked questions
What is the average salary by job uk in 2026?
The headline figure is the median full time salary of £40,911 a year in April 2026, from the Office for National Statistics. The average salary by job uk breakdown puts managers at the top of the broad groups at £56,653, while sales workers sit at the bottom at £26,959. Single jobs range from £21,239 for teaching assistants to £99,944 for chief executives.
What is the average salary in the UK after tax?
On the median salary of £40,911, the average worker takes home £2,747.96 a month in 2026/27, after £5,668 of income tax and £2,267 of National Insurance. In Scotland the same salary leaves £2,741.78 a month.
Which job pays the most in the UK?
Chief executives and senior officials are the best paid occupation, with a median of £99,944 a year, worth £5,710.41 a month after tax. Specialist doctors follow at £92,847, and IT directors at £86,033.
Why is the average salary different from the median salary?
The mean is the simple average of all salaries, and it is pulled up by very high earners. In April 2025 the mean full time salary was £48,512, well above the median for the same year. The median is the middle earner, so it gives a truer picture of typical pay.
The bottom line on pay by job
The average salary by job uk picture is clear: the job you do sets your pay far more than the national average does. Managers take home £3,618.01 a month, while sales workers take home £1,910.84 a month, and the typical worker sits between them at £2,747.96 a month.
Whatever your job, check your payslip each month and know your exact take home pay. You can see what each salary level leaves you with in our take home pay tables.